Objective Voice Quality Metrics: CPP, Jitter, Shimmer & HNR Explained
When a speech-language pathologist evaluates a patient’s voice, listening alone leaves too much to subjectivity. Objective voice quality metrics — measurable acoustic parameters derived from recorded voice samples — provide the quantitative foundation for accurate dysphonia diagnosis, evidence-based therapy planning, and reliable outcome tracking. This reference guide explains every major metric used in clinical voice assessment, with healthy ranges, clinical interpretation, and guidance on what each metric identifies.
Why Objective Voice Metrics Matter
Traditional voice evaluation relies heavily on perceptual assessment — a trained clinician listens to the patient and rates qualities like roughness, breathiness, and strain on standardized scales such as the CAPE-V (Consensus Auditory-Perceptual Evaluation of Voice) or GRBAS. While perceptual assessment is valuable, it carries inherent subjectivity: two clinicians may rate the same voice differently, and subtle changes over time can be missed without a numerical baseline.
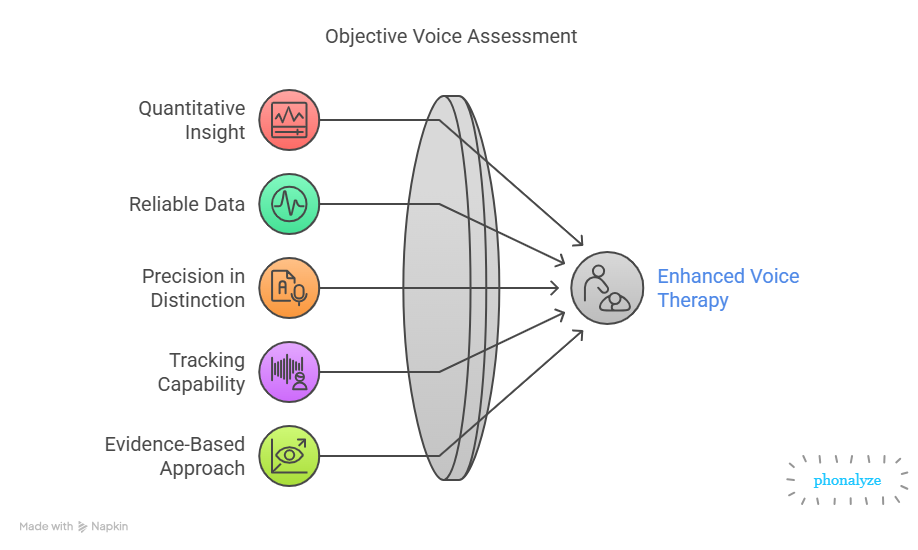
Objective acoustic metrics solve this problem. By analyzing the acoustic signal of a patient’s voice, clinicians gain:
- Quantitative data on vocal fold vibration patterns that supplements subjective listening
- Reliable, non-invasive measurements that can be repeated consistently across sessions
- The ability to distinguish healthy from dysphonic voices with greater precision
- An objective index of therapy outcomes — tracking subtle improvements week to week
- An evidence-based foundation for clinical decision-making and documentation
CPP and CPPS (Cepstral Measures)
Cepstral measures are currently the most clinically validated objective metrics for detecting and quantifying dysphonia. They capture the overall periodicity of the voice signal in a single number — making them powerful screening and outcome tools.
CPP measures the height of the dominant cepstral peak above a regression line fitted to the cepstrum. It directly reflects the clarity and strength of the harmonic structure in the voice — a high CPP means the voice has strong, regular periodicity; a low CPP means the harmonics are weak or masked by noise.
Children: Higher than adults
CPPS is CPP calculated on running connected speech rather than a sustained vowel. Temporal and spectral smoothing removes rapid fluctuations, making it sensitive to voice quality variation across naturalistic speech — the way a patient actually communicates in daily life.
Children: Generally higher than adults
Pitch (Fundamental Frequency — F0)
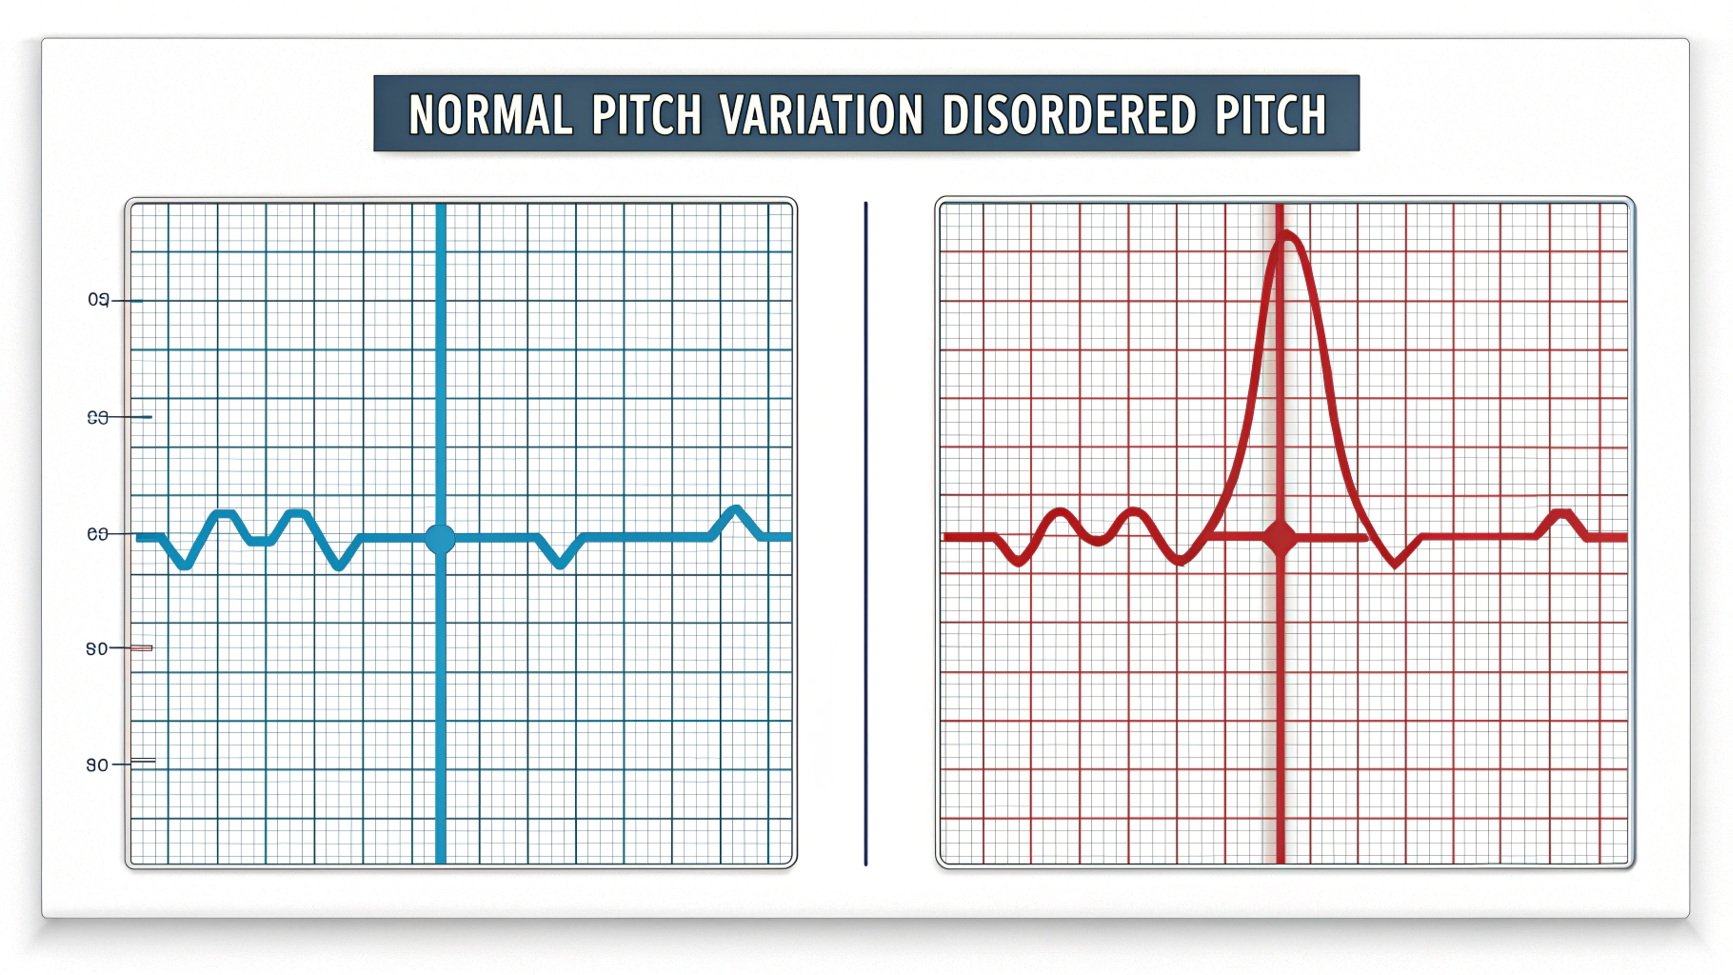
Fundamental frequency describes the rate of vocal fold vibration measured in Hertz. Clinical reports typically include mean F0 (average across the sample), median F0, and F0 range (difference between highest and lowest pitch). Together these describe habitual pitch level and vocal flexibility.
Adult females: 165–255 Hz (mean ~200–220 Hz)
Children: >250 Hz, declining through adolescence
Jitter (Frequency Perturbation)
Jitter quantifies how much the duration of each glottal cycle varies from cycle to cycle. Local Jitter measures the average difference between adjacent periods. Smoothed variants — RAP (Relative Average Perturbation, averaged over 3 cycles) and PPQ5 (Pitch Perturbation Quotient, averaged over 5 cycles) — reduce sensitivity to transient noise, making them more reliable in clinical recordings.
Children (4–6 yrs): Boys ~1.14%, Girls ~0.76%
Children (10–12 yrs): Boys ~0.82%, Girls ~0.41%
Shimmer (Amplitude Perturbation)
Shimmer measures how much the amplitude (loudness) of each glottal cycle varies from cycle to cycle. Local Shimmer is the percent variation between adjacent peak amplitudes. APQ3 and APQ5 (Amplitude Perturbation Quotient) average shimmer across 3 or 5 cycles respectively, providing smoother estimates.
Children (4–9 yrs, boys): ~0.5%
Children (10–12 yrs, boys): ~2.1%
Girls: ~0.15% across age groups
HNR and NHR (Noise Measures)
HNR expresses the ratio of periodic (harmonic) energy to aperiodic (noise) energy in the voice signal, measured in decibels (dB). A high HNR means the voice is dominated by regular harmonic vibration; a low HNR means turbulent airflow or noise predominates. Its inverse, NHR (Noise-to-Harmonics Ratio), rises as vocal noise increases — providing the same clinical information from the opposite direction.
Children: HNR ~9–10 dB (NHR ~0.10–0.14)
Females often show slightly higher HNR than males
Voicing Continuity and Voice Breaks
Voice break count tracks interruptions in phonation — moments where voicing stops and restarts unexpectedly during a sustained vowel or connected speech. The unvoiced frames percentage captures the proportion of analysis frames where no phonation is detected.
Intensity Metrics
Intensity metrics describe the loudness of the speech signal in decibels (dB SPL). Mean intensity reflects average loudness during the sample; minimum and maximum capture the dynamic range of vocal output. These parameters reflect the combined effect of subglottal air pressure, vocal fold adduction, and vocal tract configuration.
Maximum intensity: males ~80–85 dB; females ~75–80 dB
Pulses and Periods
Pulses are individual glottal cycle markers detected in the acoustic signal. Periods are the time intervals between consecutive pulses — essentially the instantaneous pitch at each cycle. Analysis of pulse regularity and period variance provides a fine-grained view of phonatory stability that complements the averaged metrics described above.
Complete Voice Quality Metrics Reference Table
The table below provides a quick-reference summary of all core voice quality metrics used in clinical acoustic voice analysis. All ranges represent values for comfortable sustained phonation unless otherwise noted.
| Metric | Definition | Healthy range (adults) | Children | Clinical significance | Identifies |
|---|---|---|---|---|---|
| CPP | Height of dominant cepstral peak above baseline regression | ≥ 14 dB (sustained vowel) | Higher than adults | High = clear voice; Low = dysphonia | Dysphonia severity (breathy/rough voice) |
| CPPS | CPP measured on running connected speech | ≥ 4.0 dB | Generally higher | Sensitive to voice quality in naturalistic speech | Dysphonia in conversational speech contexts |
| Pitch (F0) | Average fundamental frequency of voicing | M: 85–155 Hz; F: 165–255 Hz | > 250 Hz, declining with age | Habitual pitch level; deviations suggest pathology | Monopitch (Parkinson’s); hormonal/structural changes |
| Pitch range | Difference between highest and lowest F0 in sample | 1.5–2 octaves | Variable | Reduced = rigidity; Excessive = tension | Parkinson’s; vocal fatigue; hyperfunctional patterns |
| Jitter | Cycle-to-cycle period (frequency) variability | < 0.5–1.0% | 4–6 yrs: ~0.76–1.14%; 10–12 yrs: ~0.41–0.82% | High jitter = irregular frequency, roughness | Aperiodicity; roughness; organic/neuromuscular disorders |
| Shimmer | Cycle-to-cycle amplitude variability | ≤ 3–5% | Boys 4–9 yrs: ~0.5%; 10–12 yrs: ~2.1% | High shimmer = amplitude instability | Breathiness/hoarseness; incomplete glottal closure |
| HNR | Harmonic vs. noise energy ratio (dB) | 15–20+ dB | ~9–10 dB | High = clear phonation; < 10 dB = significant noise | Turbulent/breathy voice; structural lesions |
| NHR | Inverse of HNR — noise to harmonics ratio | 0.01–0.05 | ~0.10–0.14 | Rising NHR = increasing turbulence | Breathiness; hoarseness; additive noise |
| Voice breaks | Count of interruptions in sustained phonation | 0 (sustained vowel) | 0 (sustained vowel) | Any breaks = phonatory instability | Spasmodic dysphonia; severe MTD; neurological disorders |
| Intensity (mean) | Average loudness of speech signal (dB SPL) | 60–70 dB SPL | Softer; increases with age | Low = hypophonia; High = hyperadduction | Vocal fold bowing; Parkinson’s hypophonia; strain |
| Pulses / Periods | Glottal cycle markers and inter-cycle timing | Regular, count ≈ duration × F0 | Regular | Irregular/missing pulses = voicing instability | Diplophonia; double articulation; severe aperiodicity |
Healthy vs. Pathological Voice Profiles
In clinical practice, no single metric diagnoses a voice disorder. The most accurate interpretation comes from reading the pattern of multiple metrics together — a voice profile. Here is how the three primary dysphonia types present acoustically:
- CPP ≥ 14 dB (sustained); CPPS ≥ 4 dB (running)
- Jitter < 0.5% in adults
- Shimmer ≤ 3–5% in adults
- HNR ≥ 15–20 dB
- Zero or near-zero voice breaks
- Pitch and intensity appropriate for age and sex
- CPP below 9–14 dB threshold (all types)
- Elevated jitter (roughness/aperiodicity)
- Elevated shimmer (breathiness/hoarseness)
- HNR below 10 dB (turbulent airflow)
- Voice breaks present (spasmodic dysphonia, severe MTD)
- Intensity abnormally low (hypophonia) or high (hyperfunction)
The three clinical dysphonia types each produce characteristic metric signatures:
- Increased shimmer and NHR (turbulent airflow)
- Reduced CPP and HNR (less harmonic energy)
- Often lower mean intensity
- Causes: nodules, edema, bowed folds, incomplete closure
- High jitter and shimmer (irregular vibration)
- Low CPP (aperiodic phonation)
- Irregular pulse patterns
- Causes: nodules, polyps, laryngitis, neuromuscular disorders
- Relatively maintained HNR (less noise)
- Mildly elevated jitter; subtle CPP reduction
- Higher mean intensity and elevated pitch
- Causes: muscle tension dysphonia, hyperfunctional use
Frequently Asked Questions
For sustained vowels measured with Praat, a CPP value of 14 dB or above indicates healthy voice quality. For running connected speech, CPPS values of 4.0 dB or higher are considered normal. CPP values below 9–14 dB are consistently associated with dysphonia across multiple peer-reviewed studies. Children typically show higher CPP values than adults due to stronger harmonic energy relative to noise.
Jitter measures cycle-to-cycle variability in frequency (pitch) — how much the duration of each glottal cycle changes from one cycle to the next. Shimmer measures cycle-to-cycle variability in amplitude (loudness). Both reflect vocal fold vibration stability but capture different dimensions of it. High jitter is perceived as roughness or aperiodicity; high shimmer is associated with breathiness or hoarseness. Normal adult jitter is below 0.5% and normal adult shimmer is below 3–5% during sustained phonation.
A low Harmonics-to-Noise Ratio (HNR) means the voice signal contains more noise energy relative to periodic harmonic energy. In healthy adults, HNR is typically 15–20 dB or higher. An HNR below 10 dB strongly indicates a breathy or strained voice quality, often associated with incomplete glottal closure, vocal nodules, Reinke’s edema, or other pathologies that allow turbulent airflow through the glottis during phonation.
Research consistently shows that CPP and CPPS are the strongest single acoustic predictors of dysphonia severity, correlating closely with perceptual ratings on the CAPE-V and GRBAS scales (Watts & Awan, 2011; Heman-Ackah et al., 2003). HNR, jitter, and shimmer provide complementary information about the specific dysphonia type — for example, high jitter indicates roughness while high shimmer indicates breathiness. Used together as a metric profile, these measures allow clinicians to characterize dysphonia type and severity with greater precision than perceptual assessment alone.
Normal fundamental frequency (F0) ranges are approximately 85–155 Hz for adult males (mean around 120–130 Hz) and 165–255 Hz for adult females (mean around 200–220 Hz). Children have higher F0 values, often above 250 Hz, which gradually decline to adult levels through adolescence. Significant deviations from age- and sex-appropriate norms may indicate vocal pathology, structural changes to the vocal folds, or neurological involvement.
Yes. Phonalyze is a HIPAA-compliant, browser-based voice analysis platform that measures CPP, CPPS, jitter, shimmer, HNR, NHR, fundamental frequency, voice breaks, intensity, and glottal pulse analysis — entirely remotely. Patients record voice samples from home via a secure SMS link. No app download or specialist recording hardware is required. Clinicians access complete acoustic reports and can compare metrics across sessions to track therapy outcomes objectively. Read our full overview of Phonalyze’s remote voice analysis capabilities.
Effective voice therapy produces measurable improvements in acoustic metrics. CPP and CPPS values typically increase as voice quality improves, reflecting better harmonic clarity and more stable vibration. HNR rises as noise energy decreases relative to harmonics. Jitter and shimmer values tend to decrease toward normal ranges as vocal fold contact becomes more regular and complete. These objective metric changes closely track perceptual improvement ratings by clinicians, validating the therapy approach and providing motivating, visible evidence of progress for patients.
A high voice break count — interruptions in phonation during sustained vowel production — indicates severe phonatory instability. In healthy adults, sustained phonation should produce zero or near-zero voice breaks. Even a single voice break during a sustained vowel is clinically significant. High break counts are characteristic of spasmodic dysphonia (where laryngeal spasms interrupt phonation), severe muscle tension dysphonia, and neurological disorders such as essential tremor or stroke affecting laryngeal motor control.
Clinical References & Sources
- Watts, C.R. & Awan, S.N. (2011). Use of spectral/cepstral analyses for differentiating normal from hypofunctional voices in sustained vowel and continuous speech contexts. Journal of Speech, Language, and Hearing Research, 54(6), 1525–1537. doi:10.1044/1092-4388
- Hillenbrand, J., Cleveland, R.A., & Erickson, R.L. (1994). Acoustic correlates of breathy vocal quality. Journal of Speech and Hearing Research, 37(4), 769–778. doi:10.1044/jshr.3704.769
- Maryn, Y., Roy, N., De Bodt, M., Van Cauwenberge, P., & Corthals, P. (2009). Acoustic measurement of overall voice quality: A meta-analysis. Journal of the Acoustical Society of America, 126(5), 2619–2634. doi:10.1121/1.3224706
- Heman-Ackah, Y.D., Michael, D.D., & Goding, G.S. (2003). The relationship between cepstral peak prominence and selected parameters of dysphonia. Journal of Voice, 16(1), 20–27. doi:10.1016/S0892-1997
- American Speech-Language-Hearing Association (ASHA). Voice Disorders — Clinical Portal. ASHA, 2023.
- Boersma, P. & Weenink, D. (2024). Praat: doing phonetics by computer [Computer program]. Version 6.4. Retrieved from praat.org
- Phonalyze Blog. Remote Voice Analysis Tool for Speech Pathologists. Phonalyze.com, 2025.