The assessment of voice has progressed substantially past its basic foundation of audibly hearing patient voices. Speech-language pathologists currently use advanced voice evaluation techniques to measure vocal function with exact quantitative precision. The voice quality metrics of vocal sound generate fundamental data which extends the information obtained through traditional perceptual voices evaluations using Phonalyze for complete vocal evaluation.
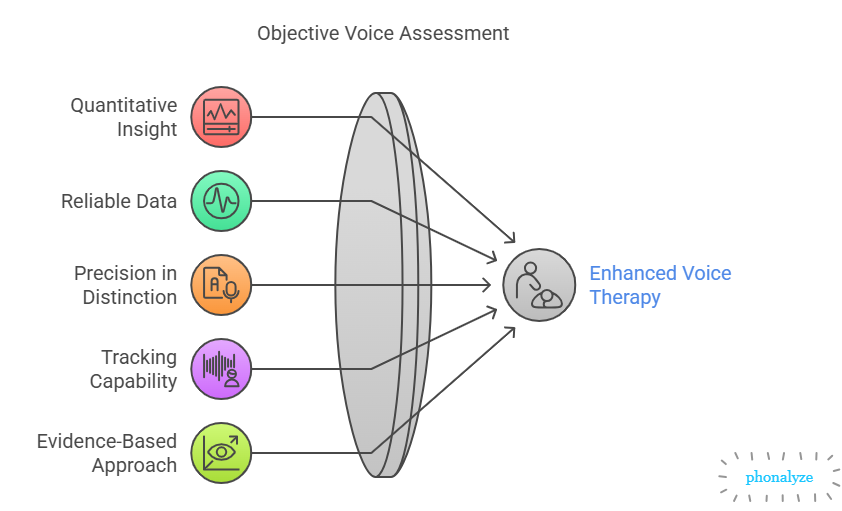
Why Objective Voice Metrics Matter
- Quantitative insights into vocal fold function that supplements subjective listening
- Reliable, non-invasive data on vocal fold vibration patterns and overall voice quality
- Ability to distinguish heathy voices from dysphonic voices with greater precision
- Tracking capability for subtle changes over time, creating an objective index of therapy outcomes
- Evidence-based approach to voice therapy with metrics that correlate with perceptual improvements
Research shows that metrics like Cepstral Peak Prominence (CPP) and Harmonics-to-Noise Ratio have strong correlations with perceptual improvements following voice therapy interventions. By incorporating these objective measurements, clinicians can significantly reduce subjectivity in voice evaluation and strengthen their evidence-based practice.
Voice Quality Metrics
Cepstral Measures: CPP and CPPS
Definition: Cepstral Peak Prominence (CPP) measures the height of the dominant cepstral peak above the regression line of the cepstrum. It reflects the clarity of harmonic structure in the voice. Smoothed CPP (CPPS) is calculated on running speech and smooths rapid fluctuations.
Healthy Range:
– Sustained vowels: CPP values typically above 14 dB (when measured with Praat)
– Running speech: CPPS values >= 4.0 dB indicate normal voice
– Children generally have higher CPP/CPPS, reflecting stronger harmonics
Clinical Interpretation: Voice signals characterized by higher CPP/CPPS scores display periodic stability along with reduced dysphonia manifestations. Weak and noisy harmonic structure exists in voices when CPP/CPPS numbers are low. These cases often result in breathy or rough quality of voice. Research demonstrates that CPP values below a specific dB threshold (9-14 dB) consistently verify dysphonic voice quality.
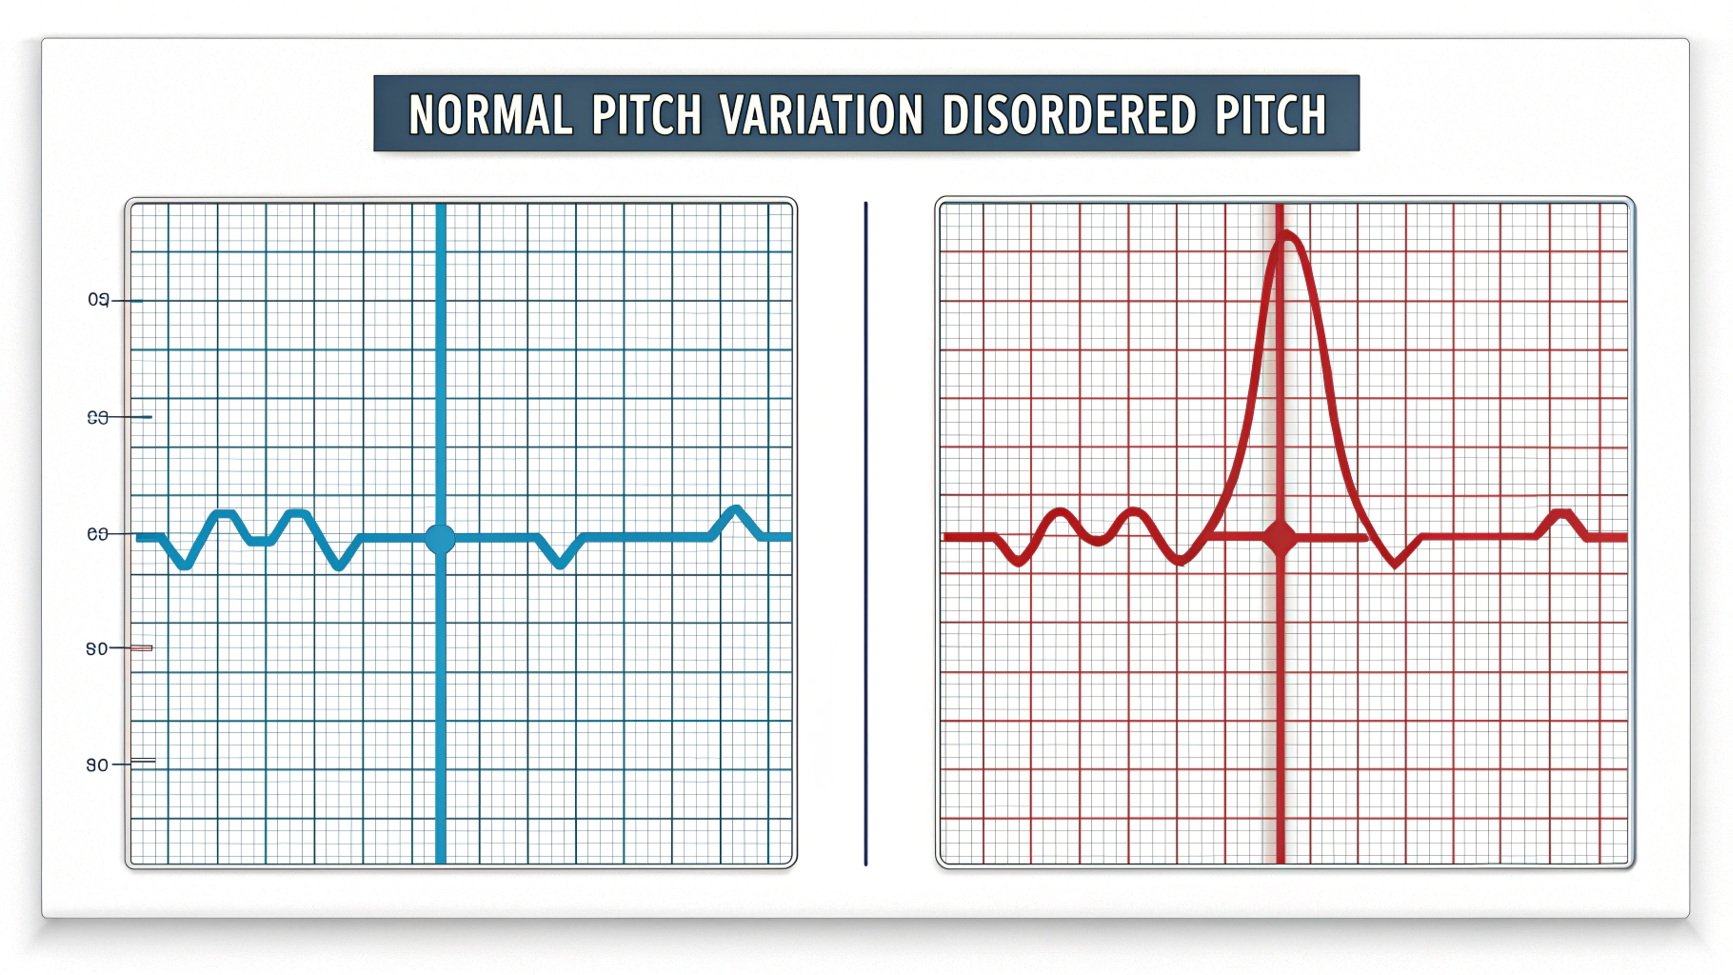
Pitch (Fundamental Frequency)
Definition: Pitch metrics describe the fundamental frequency (F0) of voicing in Hertz. Reports typically include average (mean), middle value (median), and variability (range) of F0 over the speech sample.
Healthy Range:
– Adult males: 85-155 Hz (typical mean around 120-130 Hz)
– Adult females: 165-255 Hz (typical mean around 200-220 Hz)
– Children: Higher than adults (often >250 Hz), declining to adult levels during adolescence
– Older men: Often show slight pitch increases compared to younger men
– Older women: Pitch tends to remain relatively stable with age
Clinical Interpretation: Voice level during typical situations becomes visible through mean/median pitch measurements. When voice characteristics deviate from age and gender expectations it becomes a potential indicator of both functional change and pathology. When vocal flexibility is reduced voice production becomes restricted which might signal both vocal fold rigidity and structural abnormalities.
What It Identifies: Pitch measures can flag neurological disorders (monopitch in Parkinson’s), hormonal issues, or unhealthy vocal behaviors. They can also highlight strain/compensation in hyperfunctional voice or weakness in hypofunctional dysphonia.
Frequency Perturbation: Jitter
Definition: The measurement of Jitter establishes frequency variations between adjacent periods of operation. The measurement of Local Jitter reveals the average magnitude between periods that follow each other. The smoothed variants RAP (Relative Average Perturbation) and PPQ5 (Pitch Perturbation Quotient) perform an average over 3-cycle or 5-cycle periods.
Healthy Range:
– Normal voices: Very low jitter, typically below 0.5% during sustained phonation
– Children: Higher when very young, decreasing with age (boys: ~1.14% ages 4-6 to ~0.82% ages 10-12; girls: ~0.76% to 0.41% same ages)
– Adults: Both males and females often below 0.5-1.0% in comfortable phonation
– Older adults: Similar to younger adults, with minimal age effects
Clinical Interpretation: Jitter reflects vocal stability. Higher jitter indicates more irregular vibration, often perceived as roughness or aperiodicity. Abnormal jitter suggests organic or neuromuscular issues and can increase with vocal fatigue or misuse.
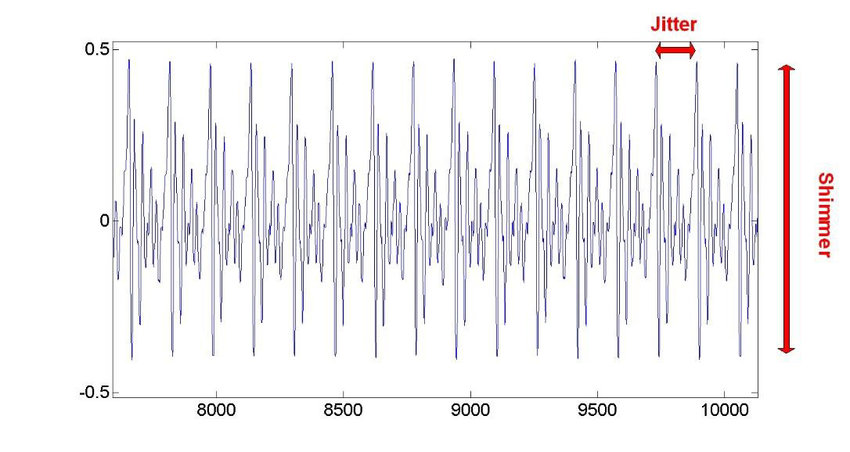
Amplitude Perturbation: Shimmer
Definition: Shimmer measures cycle-to-cycle variability in amplitude. Local Shimmer is the percent variation between adjacent peak amplitudes. APQ3 and APQ5 (Amplitude Perturbation Quotient) smooth shimmer across 3 or 5 cycles.
Healthy Range:
– Children: Varies by age and gender (boys: from ~0.5% at age 4-9 to ~2.1% at age 10-12; girls: ~0.15%)
– Adults: Typically below 3-5%
– Older adults: Similar to midlife norms
Clinical Interpretation: Shimmer reflects amplitude (loudness) stability. Breathiness and air leakage appear alongside increased shimmer measurements in voice analysis. Perceptual assessments reveal that high levels of shimmer produce a breathing or hoarse quality to speech.
What It Identifies: Increased shimmer links to breathy and hoarse qualities. Pathologies causing incomplete glottal closure (nodules, edema, weak fold tone) or irregular oscillation manifest as higher shimmer. Shimmer helps detect hyperfunction vs. hypofunction, with hypofunctional (breathy) voices often showing higher values.
Noise Measures: HNR and NHR
Definition: The voice’s Harmonics-to-Noise Ratio (HNR) measures periodic (harmonic) energy against noise energy by using decibel (dB) units. The inverse linear measure called Noise-to-Harmonics Ratio (NHR) rises in proportion to increases in vocal noise level.
Healthy Range:
– Adults: HNR typically around 15-20 dB or higher; NHR correspondingly low (0.01-0.1)
– Children: Slightly lower HNR than adults (mean NHR ~0.10-0.14, i.e., HNR ~9-10 dB)
– Gender differences: Females often have slightly higher HNR than males
– Older adults: Similar to middle-aged norms, though age-related atrophy can lower HNR slightly
Clinical Interpretation: HNR/NHR index breathiness and noise. High HNR indicates a clean, periodic voice, while low HNR signals turbulent airflow or additive noise (breathiness, hoarseness). Markedly low HNR (e.g., <10 dB) suggests a breathy or strained voice quality.
Voicing Continuity Measures
Definition: The frequency of interrupted phonation identifies voice breaks. The unmeasured percentage of analysis frames reflects the amount of speech frames without detected phonation. Both assess phonation continuity stability.
Healthy Range:
– Sustained vowel: Voice break count should be zero or very low
– Unvoiced frames: Essentially 0% in sustained phonation
– Connected speech: Some voiced-unvoiced transitions expected for unvoiced consonants
Clinical Interpretation:Voice breaks indicate severe phonatory instability. Frequent breaks or high unvoiced fraction suggest a pathological inability to maintain voicing, as seen in creaky or diplophonic voices.
What It Identifies: High voice break counts identify disorders with interrupted phonation, such as spasmodic dysphonia, severe muscle tension dysphonia, and neurological disorders affecting phonation.
Intensity Metrics
Definition: Intensity metrics describe speech signal loudness, typically in decibels (dB). They include mean intensity (average loudness), minimum intensity, and maximum intensity.
Healthy Range:
– Normal conversation: About 60-70 dB SPL
– Sustained vowel: Mean intensity around 60-70 dB
– Maximum intensity: Adult males up to ~80-85 dB; adult females around 75-80 dB
– Children: Generally speak somewhat softer, with loudness increasing with age
– Older adults: Comparable to younger adults, though some age-related hypophonia may occur
Clinical Interpretation: Intensity reflects vocal fold adduction and respiratory support. Low mean intensity may indicate glottal insufficiency or neurological weakness. Excessively high intensity could suggest hyperadduction or strain.
What It Identifies: Abnormal intensity measures detect breathy versus pressed voice quality. Tracking intensity over therapy can quantify gains in projection or reductions in strain.
Pulses
Definition: Pulses are individual glottal cycle markers detected in the signal. Periods are the time intervals between consecutive pulses (essentially instantaneous pitch).
Healthy Range:
– Pulse count should correspond to duration divided by period (no missing pulses)
– Period durations should be very regular with minimal variation
– Variance of period should be very low in healthy phonation
Clinical Interpretation: Irregular or missing pulses reveal subharmonics or diplophonia. Highly variable period duration indicates unstable phonation.
What It Identifies: These measures catch voicing instabilities like diplophonia or double articulation problems that distort the pulse train.
Voice Quality Metrics Reference Table
| Voice Quality Metrics | Definition | Healthy Ranges | Clinical Significance | Identifies |
|---|---|---|---|---|
| CPP | Height of dominant cepstral peak above baseline | Adults: ≥14 dB Children: Higher than adults | High CPP = clear voice Low CPP = dysphonia | Low CPP signals dysphonia (breathy/rough voice) |
| CPPS | CPP measured on running speech | Adults: ≥4.0 dB Children: Higher | As above; sensitive to voice quality in speech | Low CPPS (<4 dB) indicates dysphonia |
| Pitch (F0) | Average fundamental frequency | Children: >250 Hz Adult Male: 85-155 Hz Adult Female: 165-255 Hz | Habitual pitch level | Monopitch suggests neurological disorders Deviations suggest pathology |
| Pitch Range | Difference between highest/lowest F0 | Typical: 1.5-2 octaves | Indicates flexibility | Reduced: Parkinson’s, fatigue Excessive: tension, dysphoria |
| Jitter | Cycle-to-cycle period variability | Children: 0.5-1.2% Adults: <0.5% | High jitter = irregular frequency | Elevated jitter indicates aperiodicity/roughness |
| Shimmer | Cycle-to-cycle amplitude variability | Children: 0.1-2% Adults: ≤3-5% | High shimmer = amplitude instability | Flags breathy/hoarse voice Low shimmer with high F0 may signal pressed phonation |
| HNR | Harmonic vs. noise energy ratio | Adults: 15-20+ dB Children: 8-12 dB | High HNR = clear phonation Low HNR = noisy voice | Low HNR (<10 dB) indicates turbulent/breathy voice |
| NHR | Noise to harmonics ratio | Adults: 0.01-0.05 Children: 0.10-0.14 | High NHR = increased turbulence | Signals breathiness or hoarseness |
| Voice Breaks | Interruptions in phonation | 0 (ideal) in sustained vowel | Even a few breaks indicate control loss | Identifies severe dysphonia |
| Intensity | Loudness measures (dB) | Conversation: 60-70 dB Adults comfortable: 60-70 dB | Low = hypophonia High = hyperfunction | Low intensity = possible fold bowing High max = potential hyperadduction |
| Pulses/Periods | Count of glottal cycles and timing | Pulses ≈ duration × F0 Periods steady | Irregular pulses indicate double pitches | Detects diplophonia |
Healthy vs. Pathological Voice Quality
Voice Quality metrics provide clear distinctions between healthy and dysphonic voices. Typically, healthy voices demonstrate:
- Low jitter and shimmer values
- High HNR and CPP measurements
- Stable voicing with few or no breaks
- Appropriate pitch for age and gender
Pathological voices deviate from these norms in characteristic patterns:
Breathy voice:
- Increased shimmer and NHR due to turbulent airflow
- Reduced CPP/HNR (less harmonic energy)
- Often lower intensity values
Rough voice:
- High jitter and shimmer values
- Low CPP reflecting aperiodic phonation
- Potentially irregular pulse patterns
Strained/pressed voice:
- May maintain relatively high HNR (less noise)
- Often exhibits subtle irregularities (mildly elevated jitter)
- Usually higher intensity values
- Potentially elevated pitch
In clinical practice, combinations of metrics provide the most accurate assessment. For example, low CPP combined with high jitter strongly suggests significant dysphonia. By comparing a patient’s profile to healthy norms, clinicians can interpret the specific type of voice disorder present and develop targeted intervention plans.
Conclusion
Objective voice measures have become essential tools in the modern speech-language pathologist’s practice. By understanding metrics like CPP, jitter, shimmer, and HNR, clinicians can diagnose more accurately, develop tailored therapy plans, and measure outcomes quantitatively.
The Voice analysis capabilities provided by tools like Phonalyze offer a data-driven window into voice function that complements traditional perceptual assessment. This combined approach ensures comprehensive evaluation and treatment of voice disorders across all patient populations.
Ready to experience these insights firsthand? Try our demo to analyze your own voice and check your voice Quality Metrics using Phonalyze.